


At a press conference today in Madrid, Spain, ESA officials revealed examples of the work already undertaken by ESA’s Gaia satellite, as the first batch of data was released to the astronomical community. Gaia is an ambitious mission to chart a three-dimensional map of our Galaxy by surveying a billion stars and, in this taster of the richer catalogue to come, it has already pinned down the precise position on the sky and the brightness of 1142 million stars.
“Today’s release gives us a first impression of the extraordinary data that await us and that will revolutionise our understanding of how stars are distributed and move across our Galaxy,” said Alvaro Giménez, ESA’s Director of Science. “Gaia is at the forefront of astrometry, charting the sky at precisions that have never been achieved before.”
The precision that Giménez remarks on was explained by Markus Bauer, Head of Communication Department, ESAC as being able to see a one Euro coin on the surface of the Moon if GAIA was stationed on Earth.
Gaia, which will be the largest all-sky survey of celestial objects to date, will scan around one billion stars – just one per cent of the stars in the Galaxy – up to seventy times and use the positional and radial velocity measurements to answer questions about the origin and evolution of the Milky Way.
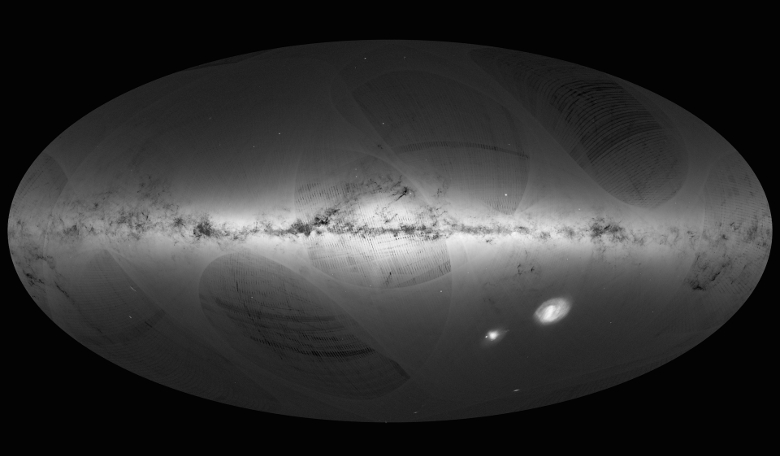
Launched 1000 days ago, Gaia started its scientific work just over a couple of years ago and in today’s announcement, scientists highlighted the research that can be done with this first data release. “The beautiful map we are publishing today shows the density of stars measured by Gaia across the entire sky, and confirms that it collected superb data during its first year of operations,” says Timo Prusti, Gaia project scientist at ESA.
The map (shown above), based on the first year of observations from July 2014 to September 2015, shows the density of stars observed by Gaia in each portion of the sky. Brighter regions indicate denser concentrations of stars, while darker regions correspond to patches of the sky where fewer stars are observed and dense clouds of interstellar gas and dust absorb starlight along the line of sight.
The Large and Small Magellanic Clouds, two dwarf galaxies orbiting the Milky Way can also be seen in the image as two bright objects in the lower right. Other nearby galaxies are also visible including the largest galactic neighbour to the Milky Way, Andromeda (also known as M31), seen in the lower left of the image, while below Andromeda is its satellite, the Triangulum galaxy (M33).
As those involved reflected on the challenges and the highlights that the mission has encountered so far, Dr Clementini, Gaia Data Processing and Analysis Consortium Member eluded to how Gaia will revolutionise all areas of astronomy, “this is only the beginning: we measured the distance to the Large Magellanic Cloud to test the quality of the data, and we got a sneak preview of the dramatic improvements that Gaia will soon bring to our understanding of cosmic distances.” With the data collected by Gaia throughout the missions lifetime, it will allow scientists to investigate our place in the Universe, from our local neighbourhood, to Galactic and even grander, cosmological scales than ever achieved before.