


Today at the ILA Berlin Air and Space Show in Germany, ESA revealed details of its second data release from its Gaia mission, which includes an impressive set of information on over 1.6 billion stars in our Milky Way.
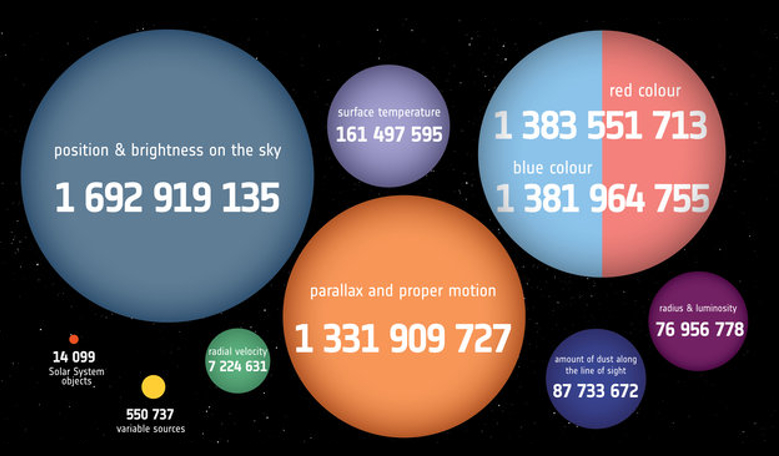
This second data release, available for download by the wider astronomical community later today, will take the census of our Galaxy to an entirely new level, as it includes three-dimensional positions and two-dimensional motions of more than 1.3 billion stars, along with their distances, brightnesses and colours.
This latter feature can help paint a bigger picture about the star as its colour gives information on its surface temperature; the hotter the star, the more blue it is; the cooler the star, the more red it is.
Gaia has achieved this impressive feat of data collection by sweeping across the sky while taking observations in a large circular motion. “In about one minute, Gaia measures about a hundred thousand stars on the sky,” said Anthony Brown, Gaia Data Processing and Analysis Consortium at the media briefing in Berlin. It takes around two months for Gaia to look at the whole of the sky and in this data release most stars will have been recorded on average about 70 times.
This multitude of measurements for each star can then be plotted to show its varying brightness as it moves around the galaxy and how it changes in size as it pulsates. Variable stars are an important tool in astronomy because their periods (how often they pulsate) are directly related to their luminosity or brightness, so they are sometimes used to measure distances within the Universe.
Not only that, but animations built from Gaia data allows the positions of stars to be seen in 3D, allowing scientists to rotate around a particular star cluster for example to see it from all sides.
Over its whole lifetime of 5 years, the satellite will take 29 independent measurements of the whole sky, giving astronomers an unprecedented look at how the stars in our Milky Way behave and evolve; data gleaned from Gaia will help to literally reconstruct the whole history of the Milky Way.
One of the highlights of this particular release added Brown, is the radial velocity data on seven million stars, which tells scientists how the stars are moving towards us or away from us. “Although 7 million might look like a small number compared with the rest, it represents the biggest radial velocity survey ever carried out over the whole sky,” explained Brown.
Information from this second release has also helped unmask some features of the Milky Way that only limited data had hinted at before. “Right below the central region (of the Milky Way is), there is a strip of stars sticking down and this is actually a dwarf galaxy being torn apart in the tidal field of our own galaxy; it is called the Sagittarius dwarf. We knew about its existence already, but this is the first time that you can just see it sitting there in a map of the star density on the sky,” said Brown.
And if that wasn’t enough, then Gaia has also mapped out the gas and dust in the sky between us and the stars, and plotted the motions of objects in the Solar System such as asteroids. This added extra has allowed the orbits of thousands of rocky and icy bodies to be mapped so accurately, that the data collected by Gaia in just over a year has eclipsed over a century’s worth of data collected by other means.