


Earth’s global average surface temperature in 2021 tied with 2018 as the sixth warmest on record, according to independent analysis done by NASA and the National Oceanic and Atmospheric Administration (NOAA). Continuing the planet’s long-term warming trend, global temperatures in 2021 were 0.85 degrees Celsius above the average for NASA’s baseline period, according to scientists at NASA’s Goddard Institute for Space Studies (GISS) in New York.
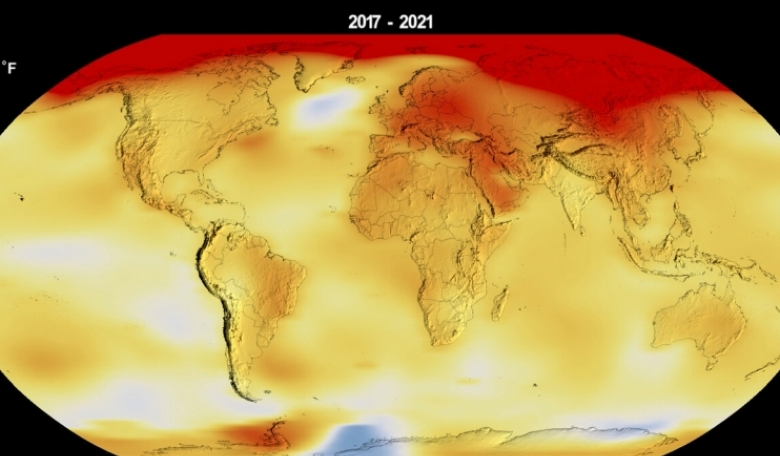
The accompanying image (credit NASA) illustrates global surface temperature anomalies for 2021 with higher than normal temperatures (shown in red) visible in regions such as the Arctic; lower than normal temperatures are shown in blue.
NASA uses the period from 1951-1980 as a baseline to see how global temperature changes over time and, collectively, the past eight years are the warmest years since modern record-keeping began in 1880. This annual temperature data makes up the global temperature record – which tells scientists the planet is warming.
According to NASA’s temperature record, Earth in 2021 was about 1.1 degrees Celsius warmer than the late 19th century average, the start of the industrial revolution.
“Science leaves no room for doubt: climate change is the existential threat of our time,” said NASA Administrator Bill Nelson. “Eight of the top 10 warmest years on our planet occurred in the last decade, an indisputable fact that underscores the need for bold action to safeguard the future of our country – and all of humanity.
“NASA’s scientific research about how Earth is changing and getting warmer will guide communities throughout the world, helping humanity confront climate and mitigate its devastating effects.”
The global warming trend is due to human activities that have increased emissions of carbon dioxide and other greenhouse gases into the atmosphere and the effects are evident in declining Arctic sea ice, rising sea levels and more severe wildfires.
Weather stations, ships, and ocean buoys around the globe record the temperature at Earth’s surface throughout the year. These ground-based measurements of surface temperature are validated with satellite data from the Atmospheric Infrared Sounder (AIRS) on NASA’s Aqua satellite.
Scientists analyse these measurements using computer algorithms to deal with uncertainties in the data and quality control to calculate the global average surface temperature difference for every year.
Other factors also affect the average temperature any given year, such as La Nina and El Nino climate patterns in the tropical Pacific. For example, 2021 was a La Nina year and NASA scientists estimate that it may have cooled global temperatures by about 0.03 degrees Celsius from what the average would have been.
A separate, independent analysis by NOAA also concluded that the global surface temperature for 2021 was the sixth highest since record keeping began in 1880. NOAA scientists use much of the same raw temperature data in their analysis and have a different baseline period (1901-2000) and methodology.
“The complexity of the various analyses doesn’t matter because the signals are so strong,” said Gavin Schmidt, director of GISS, NASA’s leading centre for climate modelling and climate change research. “The trends are all the same because the trends are so large.”