


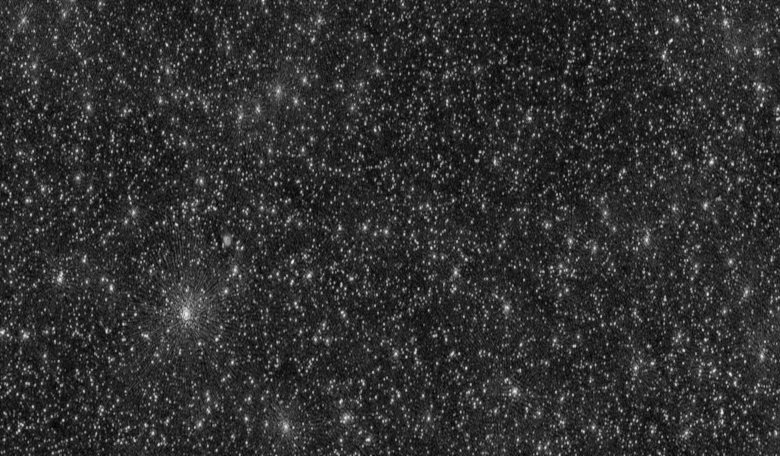
If you didn’t know any better, you could be forgiven for thinking that the image above is a map of the sky showing thousands of stars. In reality however, each of those white dots is an active supermassive black hole in its own galaxy.
Taken by an international team of astronomers using LOFAR – a Europe-wide network of state-of-the-art telescopes used to observe the Universe in unprecedented detail at low radio frequencies – the map shows 25,000 supermassive black holes in just 4 percent of the northern half of the sky.
To make the map, the team used 52 LOFAR antenna stations spread across nine European countries, over a combined 256 hours of observation time.
‘This is the result of many years of work on incredibly difficult data. We had to invent new methods to convert the radio signals into images of the sky,” says research leader Francesco de Gasperin, at Universität Hamburg, Germany about the study.
LOFAR is designed to scan the skies at at ultra-low frequencies – typically less than 100 MHz. This means that the corresponding wavelength of the emission is around 3 metres in length.
Observing the sky at long radio wavelengths is complicated. For starters, free electrons in the Earth’s ionosphere act like a cloudy lens that constantly moves across the radio telescope, making observations difficult.
‘It's similar to when you try to see the world while immersed in a swimming pool.” Co-author Reinout van Weeren (Leiden Observatory) explains. “When you look up, the waves on the water of the pool deflect the light rays and distort the view.’
Plus observers also have to deal with other radio frequency interference issues. For example the commercial FM radio band starts at about 90 MHz, so to take observations below this frequency, scientists using LOFAR have to use the array’s Low-band Antennas (LBAs).
LBAs are a subsystem of LOFAR and look like poles (called dipoles) sticking out of the ground which are tethered to a grid by wires; a surprisingly unsophisticated-looking apparatus that the team hope will eventually help them map the entire northern sky in the frequency range 42–66 MHz as part of their ongoing LOFAR LBA Sky Survey (LoLSS).
Along with LBA antennas, LOFAR also has High-Band antennas (HBA) and between them they number about 20,000 in total.
This vast number of antennas means that enormous amounts of data is generated around the clock, all day, every day. To help weed out false signals of the ionosphere, researchers run algorithms on supercomputers every four seconds to correct for atmospheric effects.
“After many years of software development, it is so wonderful to see that this has now really worked out,’ Scientific Director of the Leiden Observatory, Huub Röttgering, says.
Along with mapping supermassive black holes, de Gasperin and collaborators also hope to probe distant galaxies and quasars, to help understand how aspects of Active Galactic Nuclei (AGN) work, to study the magnetosphere of exoplanets and to provide insights into the large-scale structure of the Universe, amongst other things.
If you would like to look at the data the team waded through to make their image, it has now been made public and can be found at https://www.lofar-surveys.org/ in the form of a catalogue, which contains 25,247 sources, and a mosaic image.