


At 3:37 am on February 28, 2014, the H-IIA launch vehicle blasted off in a huge fireball. All the launch spectators, including NASA engineers, scientists and local residents, cheered as the engines ignited.
The bright white flare slowly rose in the dark and increased in speed as the H-IIA gained altitude. The flare became a large spot as it continued to climb. At 108 seconds after launch, three strap-on boosters separated and tumbled away from the central part of the main engine.
The night was dark with countless stars in the sky. The bright spot we were all following with our eyes became smaller and smaller until, at 10 minutes after launch, it was altogether difficult to distinguish from the stars. So began the magnificent launch of the Global Precipitation Measurement (GPM) core satellite.
The US ambassador to Japan, Ms. Caroline Kennedy, made a special statement before the press, saying that her father, President John F. Kennedy, believed that space has the potential to improve people’s lives. GPM is the result of 40 years’ cooperation between the US and Japan.
Indeed, the US and Japan have a long track record of cooperating in space before GPM. The Tropical Rainfall Measurement Mission (TRMM) satellite, the first US-Japan joint development project in Earth observation, was launched in 1997 to monitor tropical rainfall.
GEOSS and Japan’s priorities
Japan has been busy promoting the Global Earth Observation System of Systems (GEOSS). Prime Minister Koizumi proposed GEOSS at the Evian G8 Summit in 2003.
At the 2nd Earth Observation Summit (EOS II) in Tokyo in April 2004, he stated that Japan would aim to harmonize the needs of the economy with the needs of the environment through Earth observations. The GEOSS 10-year implementation plan and establishment of the intergovernmental Group on Earth Observations (GEO) were agreed upon at EOS III in Brussels in May 2005.
Japan announced at GEO Plenary that it would contribute to GEOSS mainly in the three Societal Benefit Areas (SBAs) of disaster, climate and water. Japan’s Earth Observation Promotion Committee issued a report in 2005 defining Japan’s ambitious Earth observation satellite program, which included TRMM and GPM; GCOM-W/GCOM-C and EarthCARE for climate change and water; and GOSAT and its follow-on satellite for global warming. JAXA has been implementing the program for the last 10 years.
Monitoring precipitation from space
For TRMM, Japan developed the world’s first space-borne Precipitation Radar (PR), while NASA developed the satellite bus and other instruments. Designed with a mission life of three years, the mission was still operating after 17 years. Nobody believed at that time that observations of TRMM would overlap with the follow-on GPM mission.
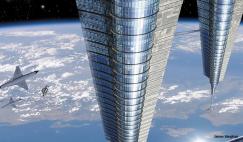
Solar panel on the Ibuki satellite. ‘Ibuki’ means breath in Japanese
Why do we measure rainfall with radar? Rain is a critically important element of the planet’s water cycle that affects all organisms, including man.
Two-thirds of natural disasters in the world involve floods or heavy rains. As global warming intensifies, super-typhoons are expected to become more frequent and rainfall issues will become more extreme, in terms of both floods and droughts.
Rainfall can be estimated using infrared and passive microwave radiometry, it can also be estimated using cloud-top temperatures and very weak microwave radiation. By contrast, radar can measure rainfall directly by emitting radio pulses to rain droplets and detecting return echoes.
Radar can observe rainfall distribution in 3D. Radar can even measure rain droplet sizes. Water vapor releases latent heat when it condenses into rain droplets. By measuring rainfall distribution, we can estimate the latent heat energy released and the energy that drives atmospheric circulation. Analysis of the 3D structure of rainfall systems will contribute to research on atmospheric dynamics and therefore contribute to better numerical modelling of rainfall system.
Japan developed the world’s first space-borne Precipitation Radar
The PR of TRMM revealed new findings on tropical rainfall. It identified torrential rainfall at an altitude of 16km, beyond anything imagined by meteorological researchers.
A PR crosscut of Hurricane Katrina in 2005 showed the rainfall in 3D, revealing the entire rainfall distribution within the thick cloud for the first time. The 17-year TRMM data archive has made an enormous contribution to climate change monitoring and research.
With both TRMM and GPM, the latitude coverage increased from 35 to 65 degrees, enabling the GPM core satellite to measure high latitude rainfall and snowfall and covering more than 95% of overall precipitation on Earth.
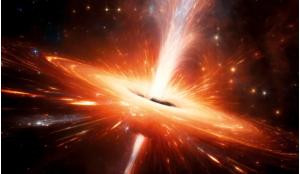
GOSAT is unique in that it can distinguish as many as 10,000 colours
JAXA developed the Dual-frequency Precipitation Radar (DPR) for GPM. DPR consists of Ka-band radar and Ku-band radar. Ka-band radar can observe weak rainfall and snowfall, while Ku-band radar can observe heavy rainfall. The sensitivity of rainfall detection also increased from 0.5 mm per hour with TRMM PR to 0.2 mm per hour (very faint rainfall) with GPM DPR. The measurement of global snowfall fills the gap in the water cycle.
Precipitation and global warming
JAXA is closely monitoring satellite radar data in order to detect any increase in annual precipitation that could be triggered by global warming. The TRMM has accumulated 17 years of data and the GPM mission has followed on from the TRMM, producing precipitation datasets that span more than 20 years. Now observations are being made to verify the results of model simulations.
JAXA produces the Global Satellite Map on Precipitation (GSMaP) every hour by combining data from more than 13 satellites, including the GPM core satellite, constellation satellites, and geostationary satellites.
GSMaP provides global rainfall distribution data with a 0.1 degree grid. Anyone can download the data for free.
Rain and snow play a critical role in our planet’s water cycle
GSMaP is currently used by meteorological agencies, water resource management agencies, and climate researchers around the world. GSMaP can also be used to predict floods when combined with river basin terrain models. GSMaP data are calibrated by ground-based rainfall gauges. GSMaP has latency of less than four hours. Efforts are now being made to shorten this to one hour.
GSMaP can provide trans-boundary rainfall information not previously available, where before only rain gauges were available.
GCOM-W
GCOM-W is the first mission of the GCOM satellites. The satellite is also one of the GPM constellation satellites. GCOM consists of the GCOM-W and GCOM-C satellites. W stands for “water”” and C stands for “climate.”
GCOM-W was launched in 2012 with the Advanced Microwave Scanning Radiometer-2 (AMSR2). AMSR2 is the successor to JAXA’s AMSR-E instrument aboard NASA’s Aqua satellite, which has been in operation since 2002. AMSR-E and AMSR2 provide very important climate data sets for the water cycle, such as sea surface temperature, water vapor, precipitation, soil moisture, snow, and ice.
AMSR2 receives a very weak microwave emission from the Earth’s surface and atmosphere with its 2-metre antenna. The antenna rotates 40 times per minute, scans the Earth surface over a 1,450km-wide swath, and can cover 99% of the Earth in a period of 48 hours, both daytime and nighttime.
Because of the characteristics of the microwave frequency, AMSR2 can measure sea surface temperature through clouds, which is critical data for maritime forecasting and climate change research. The improved spatial resolution with the large antenna allows AMSR2 to reveal finer snow and sea ice extents.
The last three decades of satellite data records have clearly demonstrated the shrinking Arctic ice extent during summer, based on observations by AMSR-E, AMSR2, and accumulated microwave radiometer data. The Arctic sea ice extent in summer 2012 was the lowest (4x10⁶km) in the satellite record. Disappearing Arctic sea ice may be monitored during AMSR2 operations, which would be a significant event demonstrating the impact of global warming.
Monitoring greenhouse gases
Japan has been tackling the challenge of monitoring greenhouse gases (GHG) from space. The original concept was to use satellites to measure atmospheric composition in the stratosphere and upper troposphere by tracking the sun through the atmosphere when the satellite saw the sun rise and set every orbit.
However, when the Kyoto Protocol was agreed at COP3 in 2002, technology was needed to verify reductions in carbon dioxide (CO2) emissions. A decision was made to change the mission completely in order to monitor tropospheric CO2 absorption and emission.
The instrument design was changed for the sole purpose of measuring GHGs, while observations were changed from monitoring the atmosphere horizontally to vertically in order to cover the entire troposphere where the greenhouse effect occurs. At the start of project, there were only 290 ground-based observation sites to monitor GHGs and these sites were unevenly distributed geographically, located mainly in industrialized countries in the Northern hemisphere and absent in the Southern hemisphere or over oceans.
GOSAT
The Greenhouse Gases Observing Satellite (GOSAT) was launched in 2009 as the world’s first satellite to monitor CO2 and methane (CH4) levels. The satellite was named Ibuki, meaning “breath” in Japanese.
The satellite was developed jointly by JAXA, the Japanese Ministry of the Environment (MoE), and the National Institute for Environmental Studies (NIES). The main user is the MoE.
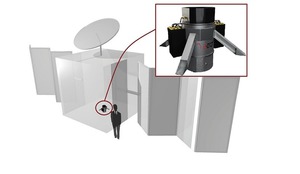
The goal of the GOSAT project is to produce more accurate estimates of fluctuations of CO2 and CH4 on a sub-continental scale. GOSAT is unique in that it uses a Fourier Transform Spectrometer (FTS) that can distinguish as many as 10,000 colours.
The FTS records both reflected sunlight in near-infrared and thermal emissions by measuring absorption of light by CO2 and CH4 molecules in the atmosphere. FTS has a circular, instantaneous field of view, yielding footprints that are about 10.5 km in diameter at nadir.
Observations have shown that CO2 occurs in higher concentrations over megacities around the world
High spectral resolution and a high signal-to-noise ratio (SNR) are achieved by integrating signals from the same field of view for 4 seconds and by compensating for satellite movement using a pointing mirror mechanism. Observations over land are collected on a three-point grid pattern, with footprints that are separated by about 260 km cross-track and about 280 km along-track. This approach yields about 10,000 soundings over the sunlit hemisphere of the Earth each day. Between 5% and 10% of these soundings are sufficiently cloud-free.
A vibrant exchange
Multiple teams around the world are working in parallel on independent CO2 and CH4 retrievals from GOSAT observations. This contributed to a vibrant exchange of ideas and methods amongst the teams and has advanced retrieval performance. These calibration, retrieval algorithm development, and validation activities are now yielding CO2 estimates with regional-scale errors of less than 2 ppm (0.5%) over much of the globe.
Important scientific outcomes include documentation of seasonal changes in the carbon balance of southern Amazonia, megacity CO2 fluxes, CO2 and CH4 ratios in wildfire plumes, and reduced carbon uptake during the 2010 Northern Hemisphere summer due to the heat wave in Eurasia.
The goal of the GOSAT project is to produce more accurate estimates of CO2 and CH4 fluctuations on a subcontinental scale
GOSAT observations have shown that CO2 occurs in higher concentrations over mega-cities around the world compared with surrounding areas, something that is probably caused by human activities. This shows how satellite-based observations can be useful to monitor GHG emissions from fossil fuel consumption. High spectral resolution data enabled the world’s first mapping of global chlorophyll fluorescence emitted from photosynthesis by vegetation, which has opened up a new scientific field on CO2 absorption by vegetation.
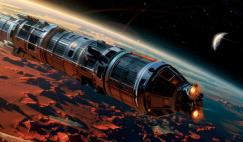
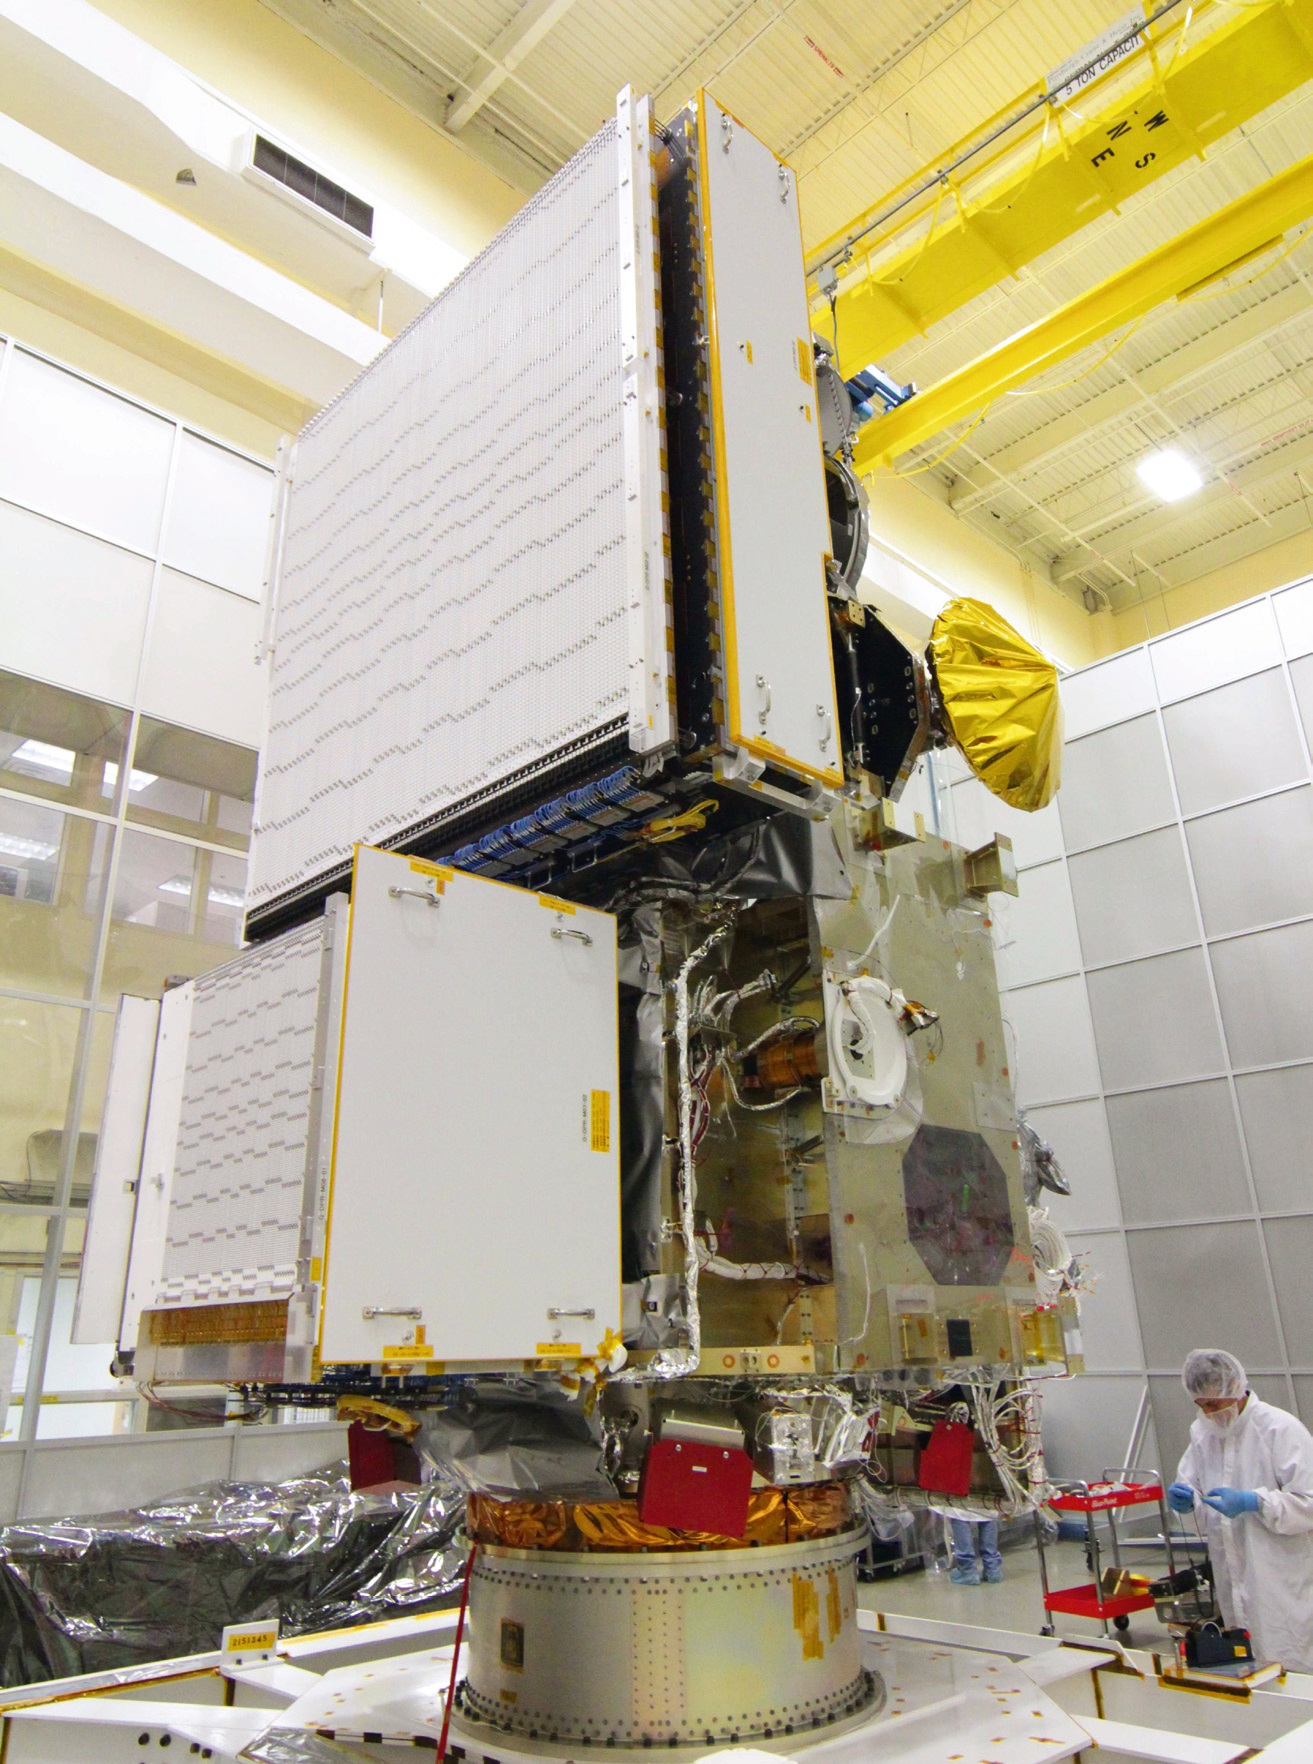 DPR aboard the GPM core observatory
JAXA, MoE, and NIES have started to develop a follow-on mission called GOSAT-2, which will monitor carbon monoxide (CO) and PM2.5, in addition to CO2 and CH4. CO observation will improve the identification of carbon emission sources that have relatively short lifetimes. To meet these objectives, GOSAT-2 will carry more advanced versions of the instruments carried by GOSAT. The current plan is to launch GOSAT-2 in early 2018.
JAXA launched MOS-1b, JERS-1, ADEOS-1/2, GOSAT and GCOM-W, and provided observation instruments for NASA’s AQUA, TRMM and GPM observatories since they launched their first Earth observation satellite, MO1-1, in 1987, and has been engaged in essential observations of land, ocean and atmoshpere.
A warning to humanity
Today, international organisations warn that climate change is already having a major impact on humanity. Major disasters caused by extreme weather can no longer be simply overlooked.
For JAXA it has become important not only to further develop satellite technology and to transmit the information that satellites gather to the world, but to utilise such information as a means of solving the issue of climate change.
Climate change is an Earth-bound problem that, today, requires space technology for its solution, and this is a challenge we must be prepared to meet head-on.